About SharePoint analytics
A dip into different API's, possibilities and why you should
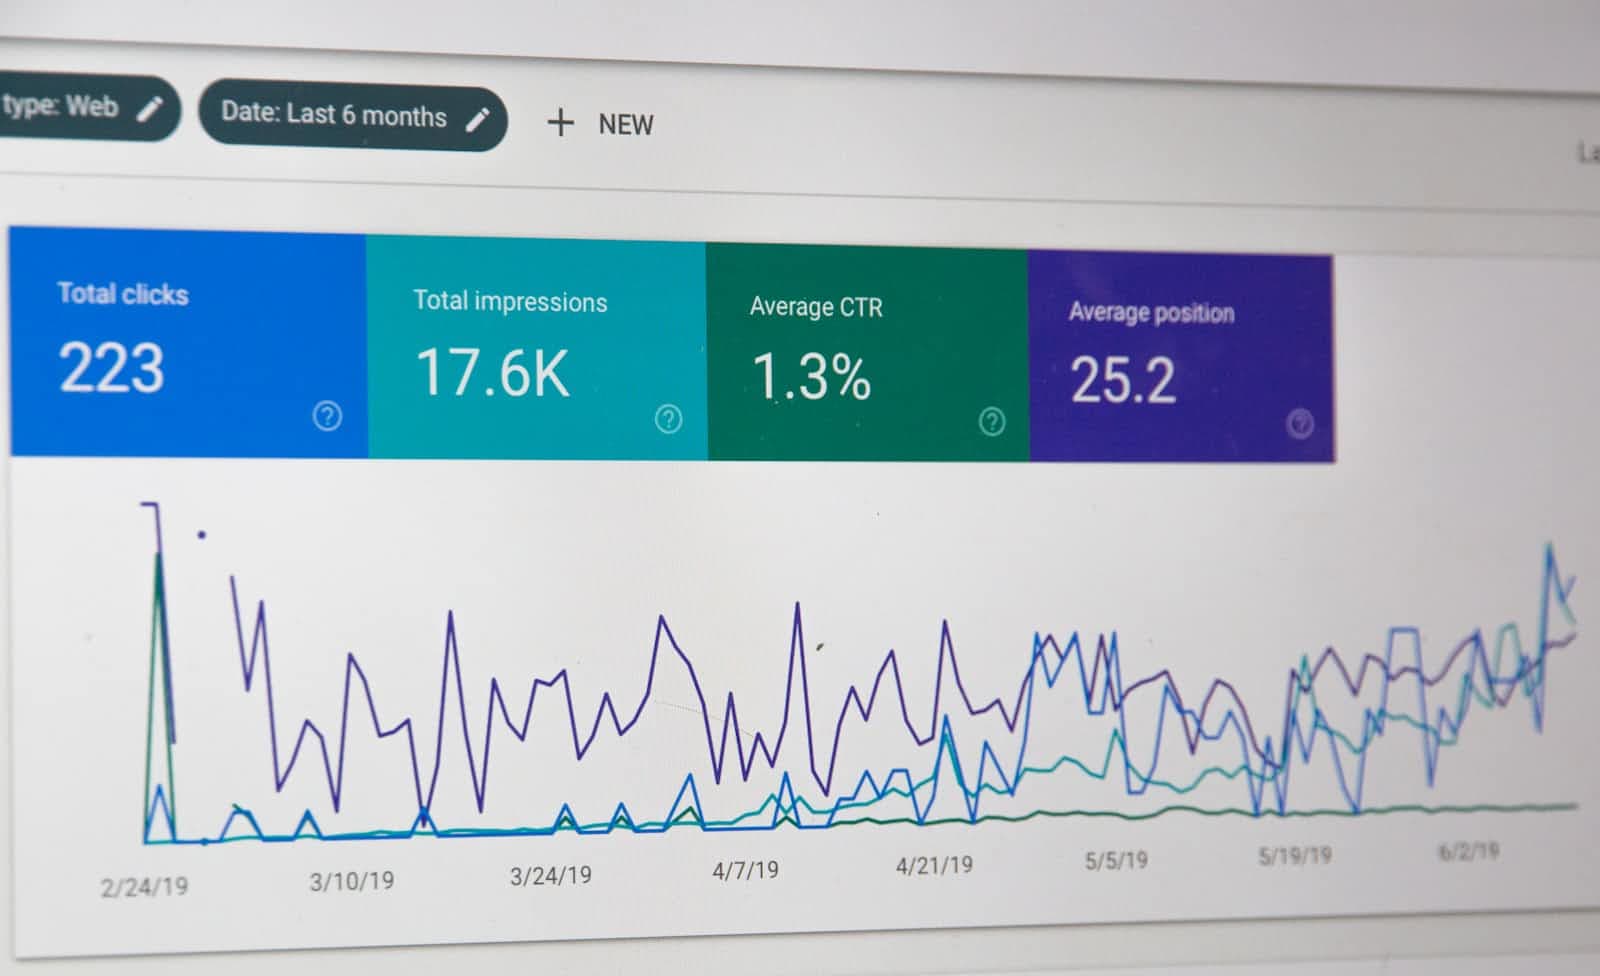
When talking about SharePoint intranets of organizations big and small, the only way to get answers to a question of "Where my users really spend time on a daily basis" is either boring polls for the users, or actually knowing and keeping track where the users roam around in your intranet.
If you're reading this, then you probably know why you need this, but if not, here's the short version of why:
You have a warehouse of information.
But you don't know if anyone goes to read it.
Has anyone even read the company policy about the new staplers?
If you do not know what is used and what is not, then how do you decide what information to update and how often? Here's where you need analytics of course.
(FYI, SharePoint Online here only)
Out of the box visuals
SharePoint has a built-in feature for analytics, but the only issue is that these analytics are pretty limited in terms of what the typical intranet power user would like to know, specifically to see more at once.
The usage analytics are accessible on the Site Usage - tab, behind the Settings - blade that opens from the cogwheel icon on top right:

Here, you'll find info about the current Site and the whole Hub (if applicable) by switching this dropdown on the right side of the page:

The collected data is limited to 90 days for a single site, and contains a few key metrics that show the user interest and engagement for the current site the analytics page was opened:

On the Hub usage data - side, the available timespan is limited to just 30 days, and you have some few insights to your hubsite usage:

These can be very handy for most, since they collect info also about the popular contents on the hub, but what if you have a multihub-solution?
Now since we're talking about SharePoint, mostly all information can be dug up from the depths, and additionally using multiple ways.
Here's a few ways to get your hands dirty with analytics!
Route 1 - SharePoint Rest API v2.0 // Graph API
Back in 2019 the v2.0 REST api for SharePoint came to life (based on Mikael Svensons post), and by using this api we can get almost the same basic analytics for single item.
Inside SharePoint, using for example _api/v2.0/sites/{SiteID}/analytics/lastSevenDays

Or the same with Graph API https://graph.microsoft.com/v1.0/sites/f92a8c43-f585-472b-b0a0-e0fdc8ef11b0/analytics/lastSevenDays

On response, we get data for visits (actionCount), unique users (actorCount) and time spent on item (timeSpentInSeconds).
You can try this easily, with the id of your sites home page, by going to https://{Tenant}.sharepoint.com/sites/{Site}/_api/site/id and then proceeding to call the analytics endpoints.
There are built in endpoints for:
- Last week - _api/v2.0/sites/{SiteID}/analytics/lastSevenDays
- All time - _api/v2.0/sites/{SiteID}/analytics/allTime
- Custom interval - _api/v2.0/sites/{SiteID}/getActivitiesByInterval(startDateTime='2024-01-01',endDateTime='2024-05-01',interval='day')
Route 2 - Query by Search
Antti Koskela has made an awesome post about the Managed properties in SharePoint Online's search index, so you should definitely check that out for more info about these, since I won't explain it here. Even though the post is from 2019, the information is still relevant since the properties are still there and nothings changed.
I built a semi-quick sample solution around this article to utilize this way of analytics fetching, to view all the sites and pages in a hub:

You can go get a copy of it from my Github - tarzzi/webpart-analytics or go build something else based on it!
Route 3 - SharePoint REST API v2.1
But wait, didn't we go trough this already? Nope, since there's more ways always, when you visit the analytics section, where does this data come from?
By looking at the Network - tab in Chrome DevTools, we find that the page is calling for example: https://{tenant}.sharepoint.com/_api/v2.1/sites/{tenant}.sharepoint.com,f92a8c43-f585-472b-b0a0-e0fdc8ef11b0,20a382a6-aced-48b5-8f46-d155dfcbe11b/oneDrive.getActivitiesByInterval?startDateTime=2024-02-16T20:16:42.587Z&endDateTime=2024-05-15T19:16:42.587Z&interval=day
To retrieve relevant data.

The first three .getActivitiesByInterval respond with the basic data (like the 2.0 endpoint) for the users and spent time, so this is the section for the current Site usage data, with different intervals:
"aggregationInterval": "None",
"startDateTime": "2024-02-16T00:00:00Z",
"endDateTime": "2024-02-16T23:59:59Z",
"access": {
  "actionCount": 0,
  "actorCount": 0,
  "timeSpentInSeconds": 0
},
The last two are for the Hub usage data
.GetAnalytics responds with the DwellTime metric:
"lastSevenDays": {
    "@oneDrive.timeSpentPercentageChange": "-70.749632533072023517883390490",
    "aggregationInterval": "None",
    "startDateTime": "2024-05-08T17:00:00-07:00",
    "endDateTime": "2024-05-14T17:00:00-07:00",
    "aggregateActivities": [
      {
        "dimension": "DwellTime",
        "key": "5/9/2024 12:00:00 AM",
        "value": 597
      }
    ]
  }
.GetHubAnalytics responds with the same data as the first three, but for the whole hub, not just the site.
{
    "@odata.context": "https://{tenant}.sharepoint.com/_api/v2.1/$metadata#sites('{tenant}.sharepoint.com%2Cf92a8c43-f585-472b-b0a0-e0fdc8ef11b0%2C20a382a6-aced-48b5-8f46-d155dfcbe11b')/analytics(lastSevenDays(),lastThirtyDays(),allTime(),itemActivityStats())/$entity",
    "@oneDrive.isDataForAllAssociatedSites": "True",
    "@oneDrive.aggregatedSitesCounts": "2",
    "lastSevenDays": {
        "@oneDrive.actionPercentageChange": "-41.73",
        "@oneDrive.actorPercentageChange": "0",
        "aggregationInterval": "None",
        "startDateTime": "0001-01-01T00:00:00Z",
        "endDateTime": "0001-01-01T00:00:00Z",
        "access": {
            "actionCount": 74,
            "actorCount": 1
        }
    },
Of course there's also the most visited News posts and documents:

That form the most visited Site pages, for example getting the pages in the hub, and sorting them by unique visitors: _api/v2.1/sites/{tenant}.sharepoint.com,f92a8c43-f585-472b-b0a0-e0fdc8ef11b0,20a382a6-aced-48b5-8f46-d155dfcbe11b/items?$filter=isof(%27oneDrive.Page%27)%20AND%20oneDrive.page/news%20eq%20null&$expand=analytics($expand=lastSevenDays)&$orderby=analytics/lastSevenDays/access/actorCount%20desc
I won't dive deeper into these, mostly because I'm lazy now, and these endpoints look too much of a hassle. But basically with this, we retrieve the items that match the filter and then use the analytics information from them to get usage data. I could see this pretty useful for some occasions!
Route 4 - Third party solutions
There's probably more analytics tools that could track your SharePoint, but here are the usual suspects, at least in my books:
Google analytics - The all-knowing
The all in one every movement tracker. Might cause GDPR issues if in Europe so watch out.
Microsoft clarity - The GDPR-compliant
Great for a base look of your intranet status, but focuses mostly on user behaviour. You get a big picture or a slice, but hard to get anything in between, since top listings (most views, least views) are limited at 10 items.
Matomo analytics - The data protector
Boasts data protection all the way. Could have issues setting up to tenant, at least I remember I had, that one time I installed this solution.
How to utilize this data?
Since the ready-made analytics feature can handle only the hub wide statistics or a single site, and no one has time to go trough all the sites day by day to see how the single site is performing, you can probably see why a custom analytics solution would be beneficial.
For inspiration, one way could be to make a PowerAutomate flow to loop trough the sites, and collect a list of these statistics, and then visualize that with PowerBI or Excel, or any reasonable data visualization option.
Or create a monstrosity of data hoarding and upload all the data daily to Azure and utilize the data platforming over there to get every inch out of that visitor data.
I tackled this problem with a SPFx webpart that has an hub-wide site and page listing option, but the possibilities are endless as always.
Thanks for reading!